
The limits of the Central Limit (theorem)
Published:
Here is a nerdy shower thought, this one is certainly going to be a bit boring for the commoners, sorry mates!
Anyways, let’s go to it. In this one, I am going to talk about some limits you might encounter (or not notice) when you apply Gaussian distribution to quantify, say a risk or an uncertainty.
Using Gaussian to predict people’s height
The usage of the Gaussian distribution is largely motivated by the Central Limit Theorem, which basically says that if you take enough samples in the real world, you will end up with a curve looking like a bell. For example, say I want to estimate the height of people entering a room, I start by measuring people as they enter, and update my model everytime. The process would look like the following gif.
In this graph, the x-axis is the height (cms) of people and y-axis represents the number of people with that height in what I sampled. As you can see, the more I collect people’s height, the more the curve looks like a bell. But what is all the fuss about this bell? Well, it turns out that once you get to this familiar shape, you can predict the height of the next person with some kind of confidence. For example, after sampling thousands of people, I can say with 95% confidence that the next person’s height is going to be between 155 and 194 cms, which seems pretty logical, isn’t it? This is called statistical inference (or prediction using machine learning in nowadays’ buzzwords) by the way.
Using Gaussian to predict people’s income
Well, now if we do the same experimentation but collect people’s monthly income (oddly enough, I always get more attention from people when talking about money). After sampling a few thousands people, I see the mighty bell shape coming back:
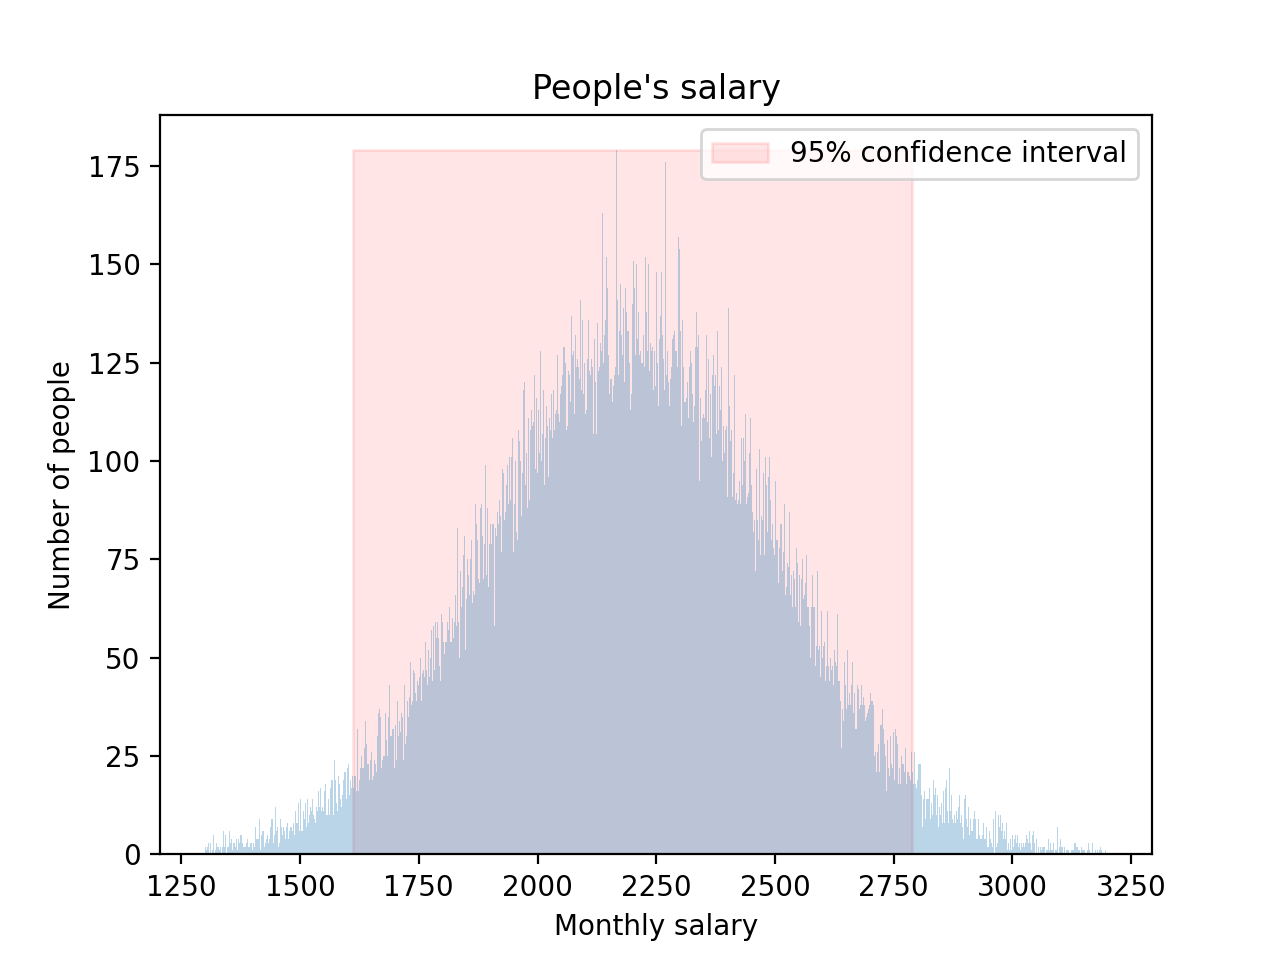
Now, I can make the same kind of prediction as for their height; with 95% confidence, I can say that the next person’s salary is going to be between 1,625 and 2,800. I can use this process pretty much everywhere thanks to the Theorem (some people even say if you have more than 30 samples you’re good to go), brilliant!
Well it turns out that if you start doing that, and making people believe you can put actual numbers on the uncertainty of everything you want to predict, you are going to be burned hard.
Imagine the next person coming to the room, his name is Swarren Blackett… and this guy makes 10 MILLIONS per months. Well, this is far off of the Gaussian distribution we have been constructing. But we said 95% confidence, not 100%, didn’t we? Yes, we did but anyways, the problem here is the magnitude of the difference between the average salary you have been sampling and this guy’s salary. Imagine the error you make when predicting the next dude has a salary of 2,200… If an unexpected event like this happens, it might ruin everything you built until then. This is called a Black Swan by Nassim Taleb, a brilliant dude.
To give you an idea of the effect of such an event on the bell curve and the 95% confidence interval, here is the same data, with my guy Swarren:
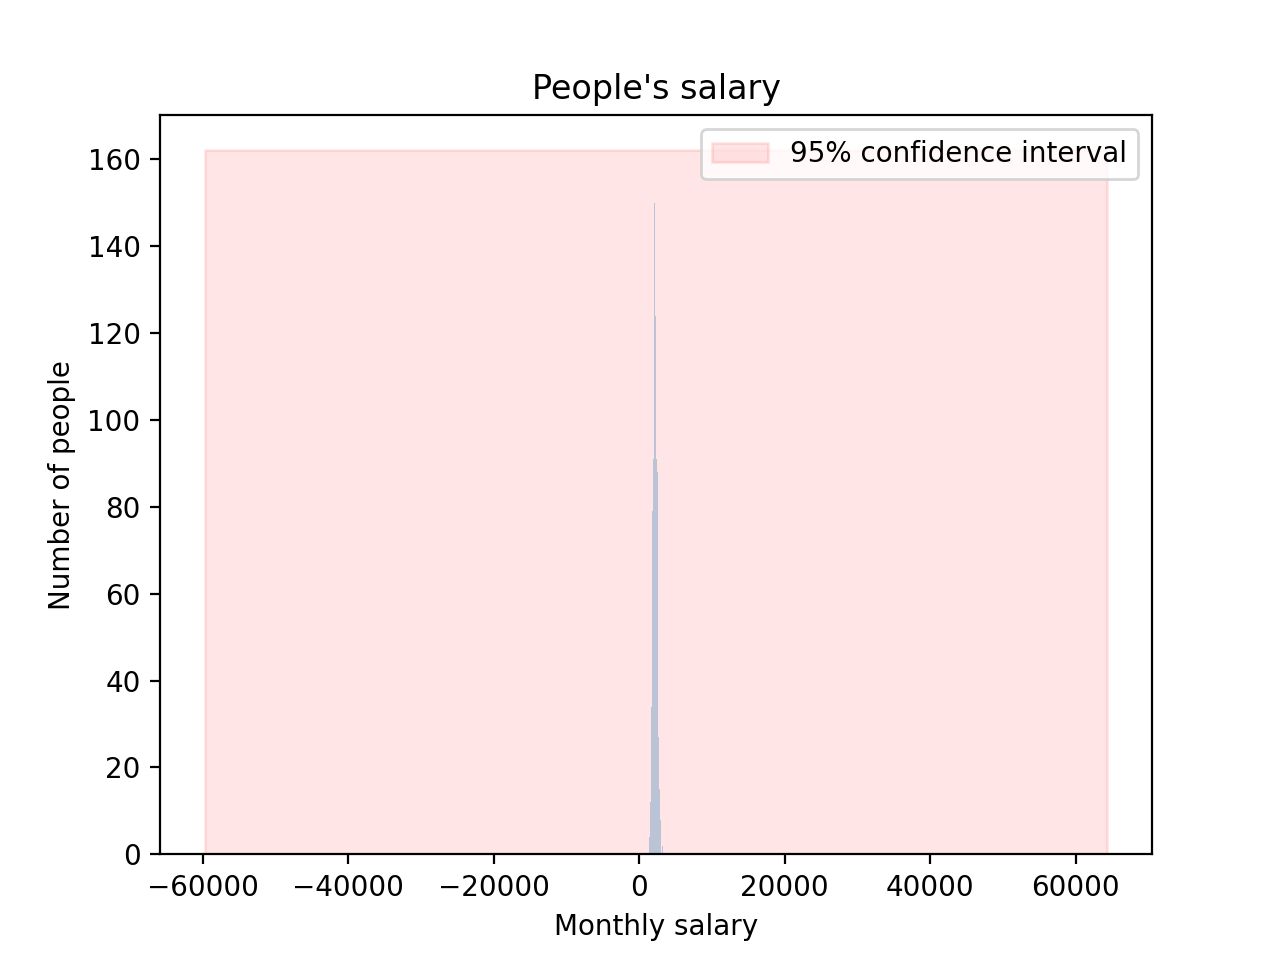
Now you are able to say with 95% confidence that the salary of the next person is between -60,000 and 65,000. Boy this does not look good anymore, heh? Take a moment to realize how it changed from the last confidence interval (1,625 to 2,800). All of this with one single person.
Gaussian usage in real life
Now a lot of people (me included until I read Taleb’s book) use and believe in these confidence intervals and uncertainty measures every day (from medicine to finance). For example, predicting with 95% confidence that a large bank is not going bankrupt 🙃. People blindly relying on Gaussian measures are not protected from unexpected events, even if they believe they do (well, technically in finance it is not even their money). And in some cases, this reasoning can cause a lot of damages (like actual lives).
Summary
We use Gaussian distributions to quantify uncertainty in a lot of cases because it is familiar and easy to manipulate;
- 1st problem: Not all kinds of data fit a Gaussian model. For example, people’s height fits such model since it seems very unlikely to encounter a person that is 4 meters tall (as the model would predict). On the other hand, we saw that people’s income does not follow such model since there are people earning way above the average.
- 2nd problem: When you think you quantify the uncertainty, you actually quantify how much the data you have seen varies. Not how much all the data can vary. There is a difference between seen uncertainty and unseen uncertainty, and the problem is that with Gaussian distribution, we only quantify the former, while the latter might have big consequences.
So what can we do?
- Question yourself if a Gaussian fits, and do not put too much trust in the model.
- There are also other distribution models, so called power-law that could fit better some kind of data.
I am no expert in statistics, thus I am going to stop here before I give wrong information. Cheers!